Blog post by Tony Zbysinski, Blog edited by Courtney Keim
December 2024

As a student of epidemiology, I see the potential benefit of my occupational health psychology (OHP) colleagues learning from epidemiologists, especially as it relates to research design and methods.
Directed Acyclic Graphs (DAGs) are one such tool that has been long utilized in the discipline of epidemiology (Howards et al., 2012). In short, DAGs can be used to illustrate causal relationships before beginning a research study. They are a strong tool to demonstrate issues of confounding variables, collider bias, mediation, and more. When developing a research question and designing a study, researchers can use DAGs (and subject matter expertise) to navigate complex questions. In this way, DAGs can provide invaluable influence in OHP study design.
DAGs vs. SEM
Structural Equation Modeling (SEM), a concept many OHP folks know well, is a similar concept to DAGs. Both SEM and DAGs are analytical techniques used in different fields and have both been around for some time. They share the ability to model complex relationships among variables but they differ in their underlying principles and applications. SEM is used to test and estimate causal relationships between variables in a theoretical framework (Kline, 2023). DAGs are a graphical tool used to represent causal relationships between variables and emphasize identifying sources of bias. Both SEM and DAGs explore causal relationships, but SEM relies on statistical modeling while DAGs provide a visual and guided selection of variables for analysis. SEM and DAGs offer complementary approaches to understanding mechanisms behind proposed relationships[1].
Drafting DAGs
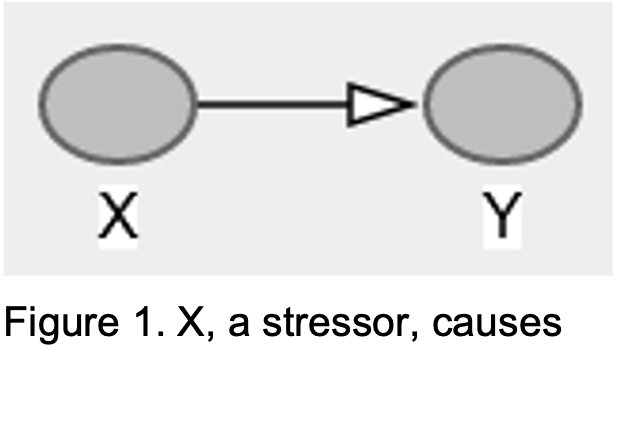
The following figures and examples[2] offer guidance on how DAGs function and how DAGs may fit into some OHP concepts. DAGs only have directed arrows. For example, in the figure below, Figure 1, X may represent a stressor, and Y a strain, thus the graph indicates that X causes Y.
However, what if psychological strain, like anxiety, can become a stressor in and of itself, thus causing more strain? This is one of the most important concepts of DAGs; they are acyclic, meaning that they do not loop (Digitale et al., 2022). This is displayed in Figure 2, where “time” moves from left to right and different time points are indicated in an example of an anxiety spiral:
- Baseline workplace stressor, X0
- Anxiety, a simultaneous strain and stressor at time 1, X1
- Strain, in the form of more anxiety, at time 2, Y2
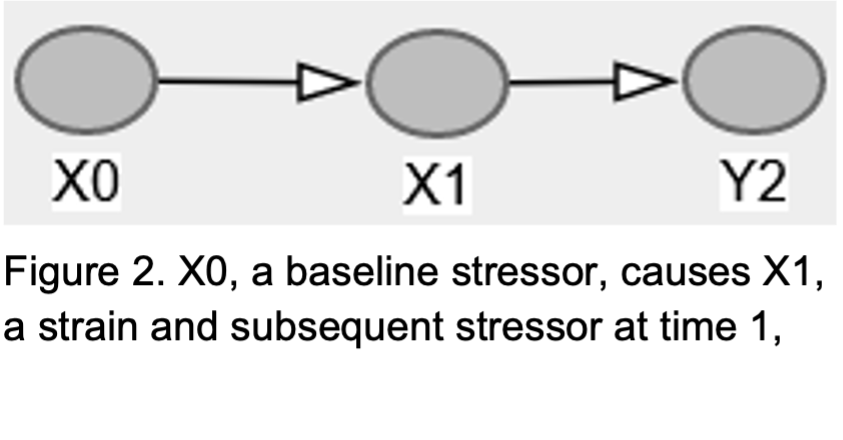
The focus of being acyclic is of high relevance to OHP due to the nature of the relationships being studied often having time-varying components, such as the study of appraisals and coping (Folkman et al., 1986).
Confounding Variables
The topic of confounding variables, such as socioeconomic status, is well known in OHP. In DAGs it is simple to show confounding. Figure 3 depicts:
- Stressor, X
- Strain, Y
- Confounding job sector, C
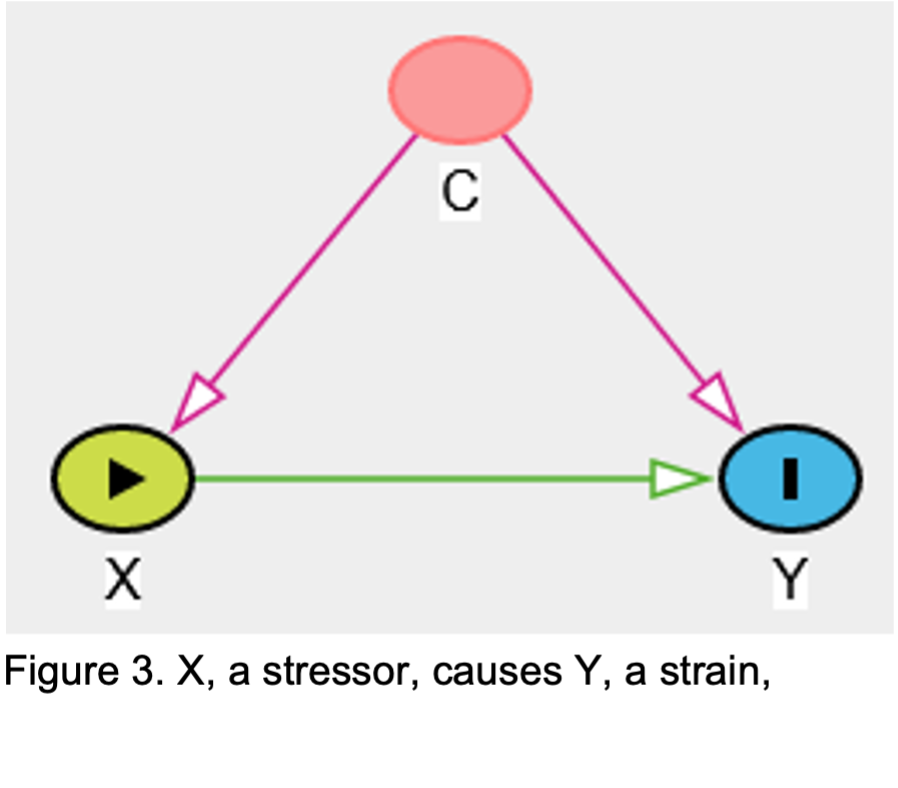
In the Job Demands-Resources (JDR) model, demands (aspects of a job that require sustained physical or psychological effort) and resources (factors that help individuals meet job demands and achieve work goals) can be related to both stressors and strains and may be confounded by job sectors (Demerouti et al., 2001; Van den Broeck et al., 2017). Due to the path going into X and Y both from C, there is an illustrated open pathway from X to C to Y. This pathway represents confounding by C, job sector. Now we know when we adjust for job sector in our analysis we effectively close this pathway and minimize confounding.
Collider Bias
Another concept depicted well in DAGs is collider bias, which is introduced when an exposure (i.e., stressor) and outcome (i.e., strain) both cause a third variable (Holmberg & Andersen, 2022). For example, if we were investigating the effect of strain on burnout, but also gathered data on job satisfaction, would we adjust for job satisfaction? This is explored in the DAG shown in Figure 4, with the variables:
- Strain, X
- Burnout, Y
- Job satisfaction, C
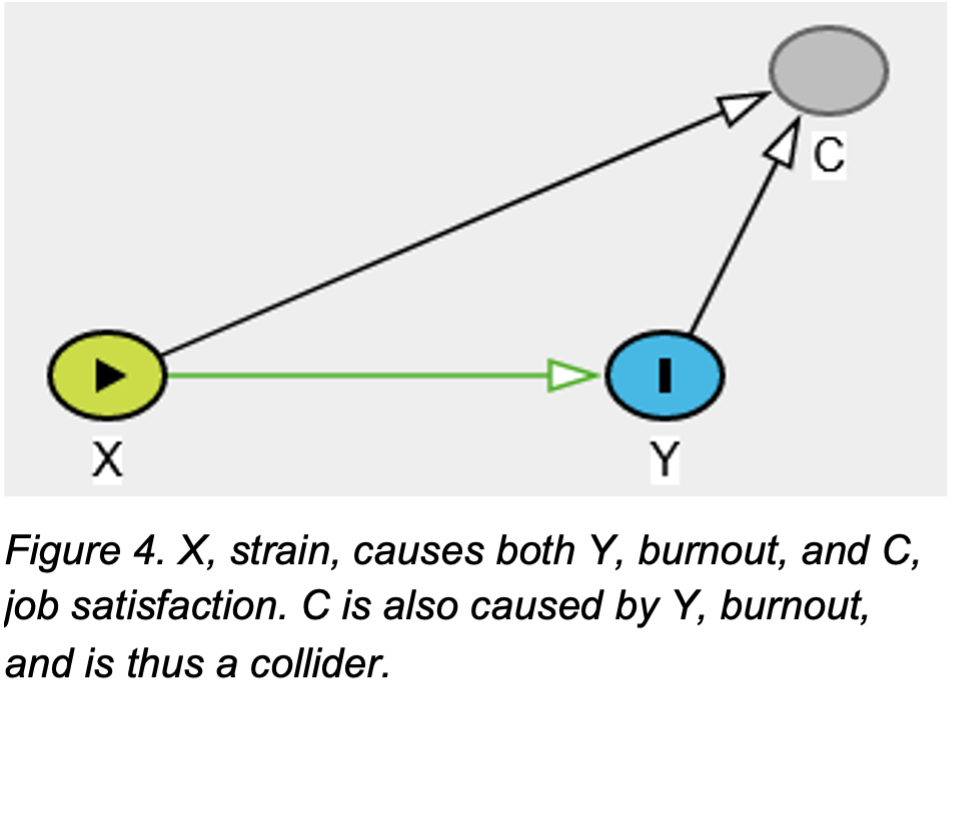
In this example, we assume strain causes both job satisfaction and burnout, but burnout also causes job satisfaction. When both these variables influence job satisfaction, job satisfaction is then classified as a “collider. The collider is not an issue leading to bias here, as the pathway from X to C to Y is considered closed because both variables cause C. Since we thoughtfully utilized DAGs, and assuming our assumptions are correct, we can come to the conclusion that no further adjustment in our models is necessary. If we inadvertently adjusted for a collider thinking it was a confounder, that would artificially open the pathway in our data leading to collider bias, resulting in a skewing of our estimates.
Mediation
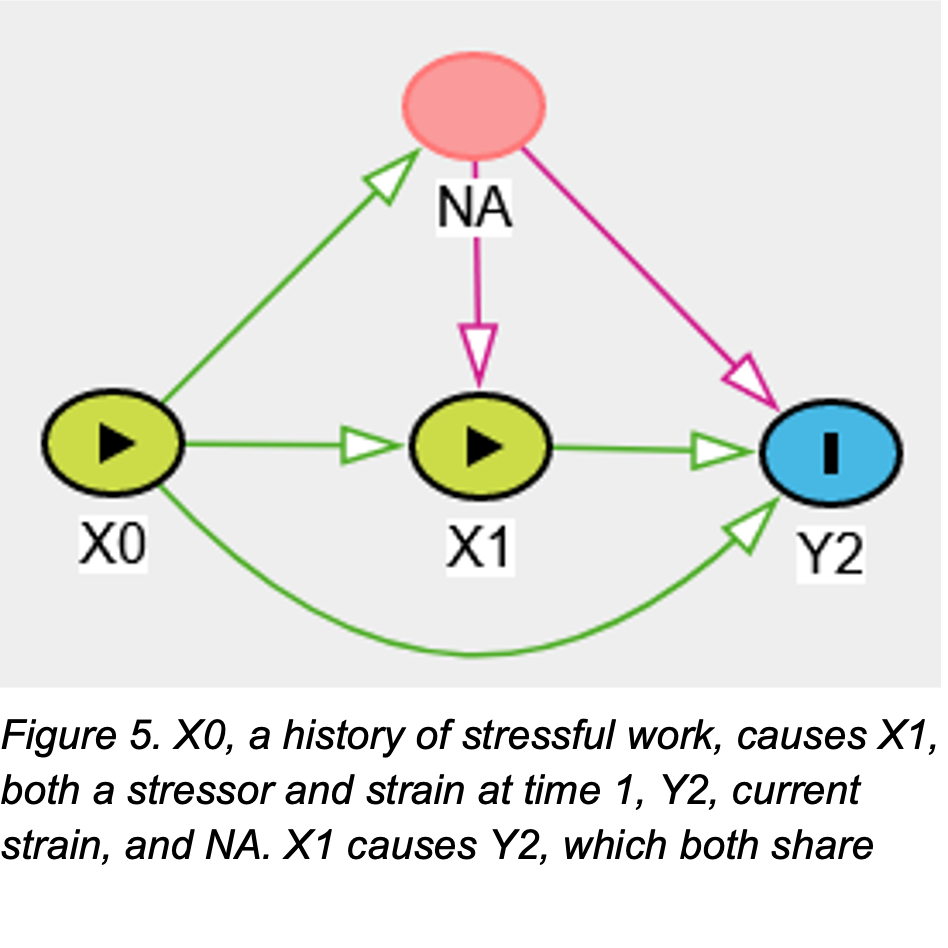
A final example of a beneficial feature of DAGs is with mediation. For example, negative affectivity (NA) is a well identified mediator covered previously in OHP (e.g., Spector et al., 2000). In Figure 5, I explore another take on NA, building upon the time-varying scenario of Figure 2 with the following variables:
- A history of stressful working conditions, X0
- A simultaneous strain and stressor at time 1, X1
- Negative affectivity, NA
- Current strain, Y2
We could assume that a history of stressful work conditions may cause NA, and NA could cause both X1 (strain and stressor) and Y2 (current strain). The DAG in Figure 5 allows for many study questions, designs, or analyses to be posed to explore and verify these relationships. This DAG aligns more with the perspective of Spector and colleagues, showing that NA is a mediator of lifetime work stressor’s total effect on strain. One simple example of a question would be if a researcher wanted to study only X1’s effect on Y2, in this way NA and X0 would serve as confounding variables and would need adjustment.
Conclusion
DAGs can serve as a tool for causal inference, research question, and hypothesis building in OHP. Furthermore, they can contribute by illuminating complex situations such as with lagged effects. DAG’s applicability grows with the current emphasis on longitudinal OHP research. Through their acyclic nature and potent ability to facilitate understanding of time-varying situations, DAGs have much to offer and can improve the rigor, methodological design, and validity of future OHP studies.
*Author Note: I am deeply appreciative of Dr. Kimberly French’s expert support in the writing of this work and her strong encouragement to seek out a means to contribute to the field.

Tony Zbysinski is currently a third-year epidemiology PhD student and Mountain and Plains Education and Research Center Ergonomics and Safety Trainee at Colorado State University. He has previous experience in epidemiology data collection when he pursued his master’s in public health. Tony’s current research focuses on radiation epidemiology, specifically how several forms of bias may obfuscate the relationship between ionizing radiation and risk of neurodegenerative disease, and the role of work design interventions in prevention. Practicing occupational health psychology principles, Tony prioritizes work-nonwork balance, recovery, and healthy coping to support his mission of conducting decent, meaningful, and impactful research.
[1] For more information on comparing and contrasting SEM and DAGs, Quantitude Season 5 Episode 23 is recommended to readers (Curran & Hancock).
[2 ] All figures were illustrated using the online browser version of “DAGitty” (Textor et al., 2016).
